menu Home Planning Development eXECUTION advocacy
  factsheets academicArticles policyBriefs presentations evaluation space
blanco
 
img21
ant sig

Evaluation tools for the Ciclovía Recreativa

part 3 of 7


Network Analysis

What does it consist of?

This study consists of the identification of all the possible actors that may be involved in the development, implementation and execution of the Ciclovía Recreativa and includes an investigation and description of the possible relationships that exist between them.

What is its purpose?

To understand the relationships that exist, or should exist, between each of the entities, organizations and institutions involved in the process of development, implementation and execution of the Ciclovía Recreativa. Once it is understood how the network functions, it is possible to reinforce the existing relationships.

With this tool you want to answer a series of questions that arise during the development of a Ciclovía Recreativa, such as: Which entities should be involved in carrying out some action related to the Ciclovía Recreativa?, Which entities are the most suitable for carrying out some action in the development of the Ciclovía Recreativa? What type of relationships should exist among these organizations and how will they work? Who should be the contact between all of the involved groups?

Additionally, this tool works as an epidemiological tracking instrument to follow the evolution of the program and the relationships between the actors over time.

Requirements

  • Cultural adaptation of the questionnaire.
  • Personnel trained in specialized software.
  • Access to special network analysis software such as Ucinet, Pajek and R.

What steps should be followed?

Step 1: Review of Secondary Sources
Initially you should conduct a literature review in which you can identify some key actors that are somehow involved in the Ciclovía Recreativa. The actors can represent individuals or groups. The review can include documents such as: history of the Ciclovía Recreativa, websites of bicycling organizations, information from government entities with functions related to Ciclovía, blogs related to bicycling or Ciclovía Recreativa programs.


Step 2:. Identification of Actors
One of the most-used techniques for this type of analysis is the 'Snowball Technique'. This technique assumes that the actors or group members are all interconnected and know one another, either personally or by reputation. You can ask the previously identified actors for other actors that have influence over the Ciclovía Recreativa. This will guide the search for new informants until all the most important actors are found.  Other techniques exist in which the central actor or the individual in charge of the Ciclovía Recreativa identifies the majority of the actors that are or could be involved in the program.


Step 3: Development of Data Collection Tools
The next step is the development of the questionnaire.

clipBogotá´s Ciclovía Network Analysis Questionnaire

The key concepts of the questionnaire are:

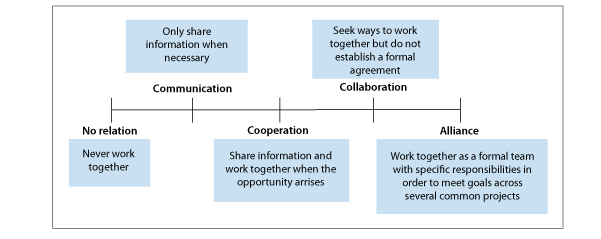
  • Relationship and Integration: This is the type of link.  It is classified in the following form:

fig1

  • Contact: The contact between actors can be measured qualitatively (none, little, medium, high, very high) or quantitatively (daily, weekly, monthly, annually).
  • Importance: This is the actors' perception of the relevance of their relationship with each of the other actors.
 

Step 4: Conducting the Survey
The questionnaires should be applied in person, over the phone or via e-mail.


Step 5: Analysis
During this stage, the inter-organizational connections that exist between the actors are analyzed statistically. This allows the network of actors to be visualized and measured.

The stages of the analysis are listed below:

  • Network Visualization: With the help of specialized software (Ucinet, Pajek or R), the involved actors and the connections that exist between them are visualized graphically (the actors as circular 'nodes' and the connections as lines between nodes). As a result, the software produces a structured network.
  • Descriptive Analysis: The properties of the network are analyzed using the following estimates:

    Degree: This is the connectivity that one actor has with the others.

    Density: This provides information on the number of connections in the network, as a proportion of the maximum number of possible connections.

    Centrality: This measure indicates the link or pathways with other nodes and is represented by the size of the node.

    Centralization: This indicates the variance in the centrality of all of the nodes.


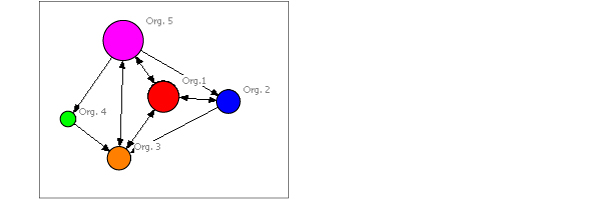
Here is an example of a network and a brief interpretation:

Figura: Example of an Organizational Network

red


There are five organizations in this network. The colored circles represent the actors/organizations and are called nodes or vertices. The color indicates they type of organization and the size represents centrality. The lines or arrows show the interactions between nodes and also provide information about the direction of the relationship. For example, organization 5 has a link or connection with organization 4, but from the point of view of organization 4, there is no such connection. In contrast, organizations 1 and 5 have a mutual link indicating a reciprocal relationship. The node for organization 5 is the largest, signifying that the centrality of this organization is greater than the others.


For more information, contact Roberto Zarama: rzarama@uniandes.edu.co or Olga Lucia Sarmiento: osarmien@uniandes.edu.co

Additional references can be found in the complete version of the manual (download)


<< previous next >>
 
 
white
Quienes Somos Contactenos Descargas Enlaces